By alphacardprocess November 17, 2025
Using POS data well is one of the fastest ways a U.S. retailer or restaurant can boost sales, cut stockouts, and stop tying up cash in slow inventory. Modern point-of-sale systems are no longer just fancy cash registers. They collect real-time sales data, inventory levels, and customer behavior, then turn that into dashboards, alerts, and reports you can act on every day.
In this guide, we’ll walk through how to use POS data to track sales and improve reordering, step by step. We’ll focus on practical, store-level tactics that work for U.S. retailers, quick-service restaurants, and small multi-location businesses.
By the end, you’ll know exactly which reports to run, which KPIs to watch, and how to build a simple, data-driven reordering routine that actually fits into your week.
What Is POS Data and Why It Matters for U.S. Retailers

POS data is every piece of information your point-of-sale system captures at checkout and during related operations. That includes product sold, price, time, payment method, discounts, staff ID, customer profile, and the changes to inventory in real time. In a modern cloud POS, this POS data syncs to a central database for analysis, reporting, and forecasting.
For a U.S. business, POS data is especially valuable because it is granular, real-time, and tied to actual transactions, not guesses or rough spreadsheets. Instead of relying on monthly summaries or gut feel, you see exactly which SKUs are selling, at what price, and in which locations.
When you connect your POS data to inventory and purchasing, you can build smarter reordering rules that maintain availability without overstocking. POS data also provides visibility across online and in-store channels.
If you run both an eCommerce site and a physical shop, an integrated POS can show how customers move between channels, what they buy where, and which products need deeper stock to support omnichannel sales. That’s vital in the U.S., where shoppers expect click-and-collect, curbside pickup, and easy returns.
Finally, POS data is the foundation for advanced retail analytics like demand forecasting, basket analysis, and promotion tracking. These tools used to be reserved for big chains.
Today, many cloud POS vendors bake them into their standard subscriptions, which means even a small boutique or café can use POS data to track sales and improve reordering like a large retailer.
Key Types of POS Data You Should Track for Sales and Reordering
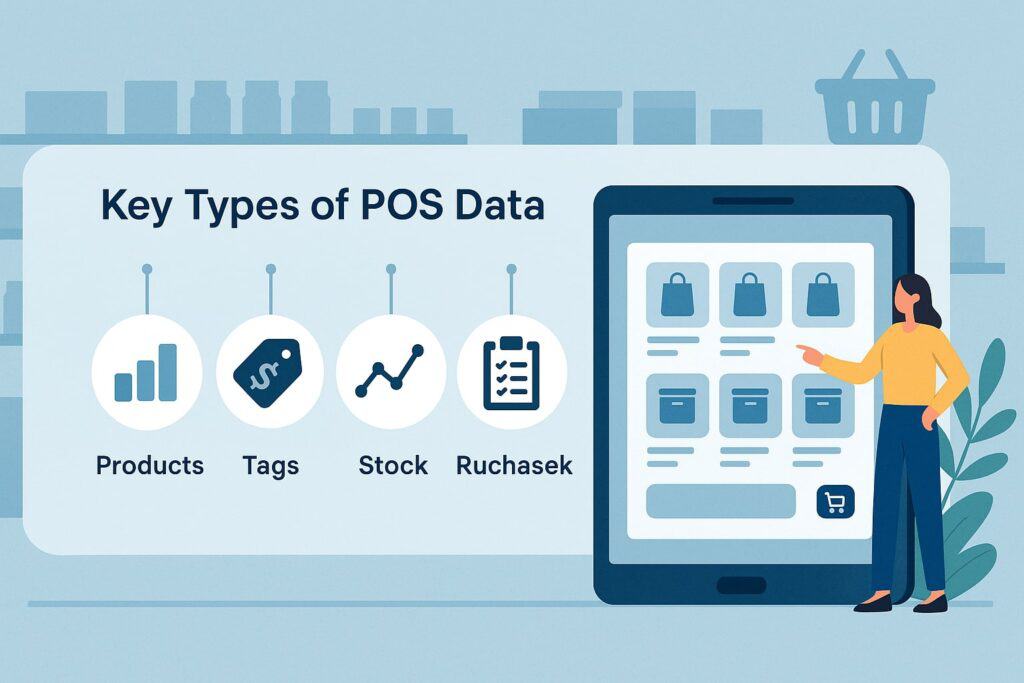
To use POS data effectively, you need to know which data types matter most for tracking sales and improving reordering. Your POS collects a lot, but a focused set of fields drives most inventory decisions.
Start with product-level sales data: SKU, product name, category, brand, unit price, discounts applied, quantity sold, and gross sales. This POS data lets you see top sellers, slow movers, and category trends over time. It’s the core input for deciding how much to reorder.
Next is inventory and stock movement data. Your POS and inventory module should track on-hand quantity, units on order, committed stock (for open orders), returns, and shrinkage. This POS data drives reorder points and helps you spot stockouts, negative inventory, or data issues quickly.
You should also pay attention to time-based POS data: date, time of day, day of week, and season. This helps with seasonal planning and staffing, and it also tells you which items spike during holidays or weekends so you can reorder more aggressively ahead of those peaks.
Finally, add customer and channel data when possible. Loyalty profiles, ZIP codes, and purchase history give you insight into regional preferences and repeat buying patterns across your U.S. customer base.
Channel tags like “in-store,” “online,” “mobile” or “BOPIS” help you align reordering with where demand actually happens. Together, these pieces of POS data form a complete picture of your sales and inventory needs.
Setting Up Your POS System for Clean, Reliable Data

Before you can use POS data to track sales and improve reordering, you need clean, consistent data. Many U.S. retailers struggle not because they lack POS data, but because item catalogs are messy, units of measure are inconsistent, or staff use workarounds at checkout. A few foundational steps will dramatically improve your data quality.
First, standardize your product catalog. Ensure every item has a unique SKU, clear name, category, vendor, unit of measure, and cost. Use barcodes for scanning and avoid manual item creation at the register. Enforce rules so staff can’t create new SKUs on the fly, which fragments POS data and breaks reports.
Second, align inventory units and packaging. If you buy by the case but sell by the unit, configure your POS to handle conversions correctly. Otherwise, your POS data will show inaccurate on-hand quantities, and reorder points won’t match reality.
This step is especially important for U.S. businesses dealing with vendor pack sizes, minimum order quantities, and promotions like “buy one, get one.”
Third, train staff on checkout procedures. They should scan barcodes instead of using generic “miscellaneous” buttons, apply promotions correctly, and avoid voiding items incorrectly. Employee training may not sound like a data project, but it directly influences POS data accuracy by reducing errors and missing details.
Finally, integrate your POS with your eCommerce platform, accounting system, and inventory software where possible. When systems sync automatically, your POS data flows through to purchasing, invoicing, and financial reporting without manual exports and imports.
This integration step turns POS data into a single source of truth for your business and sets the stage for automated reordering in the future.
Tracking Sales Performance with POS Data: Core KPIs
With clean POS data in place, you can start using that POS data to track sales performance. A few simple KPIs will give you a powerful view of how your products, categories, and locations are performing in the U.S. market.
Begin with total sales and units sold by SKU, category, and vendor. This POS data tells you what is moving, what is stagnant, and which brands deserve more shelf space. You can run these reports weekly and monthly to catch shifts early.c-c
Track average transaction value (ATV) and items per transaction (IPT). These metrics show how effectively you’re cross-selling and upselling. If your POS data shows strong unit sales but low ATV, you may need to adjust bundles, add impulse items at checkout, or refine promotions.
You should also monitor gross margin by product. High sales volume doesn’t always mean high profit. POS data combined with item cost tells you which SKUs generate the most margin dollars, not just the most revenue. This helps you prioritize reordering of profitable items, not just popular ones.
Finally, use your POS data to track sell-through rates and turnover. Sell-through compares units sold to units received in a period, while turnover measures how many times your inventory turns in a year. Healthy turnover means you’re not tying up cash in slow stock, and it’s a key indicator for whether your reordering strategy is working.
Using POS Data by Product and Category to Guide Reordering
To improve reordering, you must move from aggregate sales reports to SKU-level POS data by category. This is where product assortment and replenishment start to align with real customer demand. Start by ranking products within each category by units sold and margin dollars over a relevant period, such as the last 90 days.
Your POS data will quickly reveal a classic pattern: a small number of SKUs drive most of your sales and profit, while a long tail barely moves. This is the basis for ABC analysis, where A-items are top sellers, B-items are moderate, and C-items are slow.
For A-items, use POS data to maintain higher safety stock and more frequent reorders, because stockouts are costly. For C-items, consider reducing on-hand quantities, switching to special order only, or discontinuing them entirely. Many U.S. retailers free up shelf space and cash by pruning low-velocity products identified in POS data.
POS data by category also helps you understand mix and substitution. If one flavor or size sells out, do customers switch to another, or do sales disappear?
By comparing POS data across similar SKUs, you can see which items are interchangeable and which are unique demand drivers. That insight shapes your reordering strategy so you stock deeper on true “hero” products and lighter on niche variants.
Over time, revisiting category-level POS data each month lets you continually refine your assortment and reordering rules. This continuous tuning is a key part of agile retail, where you adjust quickly to U.S. consumer preferences rather than locking into a static plan for the year.
Using Time-Based POS Data: Seasons, Weekdays, and Dayparts
Time patterns in POS data are crucial for both sales tracking and reordering. Customers in the U.S. don’t buy the same things every day or every season, and your POS data captures those patterns in detail.
At a basic level, look at sales by day of week. Many retailers see stronger traffic on weekends, while some convenience or grocery stores spike mid-week. Your POS data will show not just total sales, but which SKUs surge on specific days. That information helps you plan reorders so high-demand items arrive before your busiest days, not after.
Then review hour-of-day or daypart sales. Quick-service restaurants often see strong breakfast, lunch, and dinner peaks, each with different hero items. Using POS data to understand these patterns lets you align prep, staffing, and reordering with real demand.
If canned beverages spike in the late afternoon in summer, for example, you may need higher reorder quantities leading into those months.
Finally, use your POS data to track seasonal demand around holidays, weather shifts, and local events. Look back at last year’s sales around Memorial Day, July 4th, Thanksgiving, and Christmas. That historical POS data becomes your starting point for forecasting and reordering this year, with adjustments for growth and any changes in your product mix.
By layering time-based insights on top of SKU analytics, you move toward truly proactive reordering. You’re no longer reacting to stockouts; you’re using POS data to anticipate demand and schedule orders so the product is on the shelf when customers want it most.
Building Reorder Points and Safety Stock from POS Data
A powerful way to use POS data to improve reordering is to set reorder points and safety stock based on actual sales velocity and lead times. Instead of guessing how much to keep on hand, you build rules that trigger orders at the right moment.
First, calculate average daily usage from your POS data. For each SKU, divide the units sold over a stable historical period by the number of days. For example, if POS data shows 300 units sold in 30 days, your average daily usage is 10 units.
Next, determine vendor lead time in days. Look at purchase orders and receiving records to see how long it typically takes from placing an order to the items being available for sale. Combine POS data with purchasing system data to get accurate lead times.
Your basic reorder point formula is:
Reorder Point ≈ (Average Daily Usage × Lead Time) + Safety Stock
Safety stock accounts for variability in demand and supply. You can start with a simple rule of thumb, like keeping an extra week of sales on hand for A-items and a few days for B-items. As you gather more POS data, you can refine safety stock using demand variability and service-level targets.
Many POS and inventory platforms now include built-in replenishment suggestions that use this type of POS data logic automatically. You still control the parameters, but the system issues purchase order recommendations when items hit their reorder points. That turns raw POS data into concrete reordering actions, saving time and reducing stockouts.
Using POS Data to Manage Vendor Relationships and MOQs
Vendor constraints like minimum order quantities (MOQs), case packs, and price breaks are a reality for U.S. retailers. Your POS data helps you navigate those rules while maintaining availability and healthy cash flow.
Start by linking each SKU in your POS and inventory system to its primary vendor, case pack size, cost, and MOQ. Then use POS data to estimate how quickly you’ll sell through a case. If your POS data shows that you only move one unit per week of a slow product, but the vendor requires a 48-unit case, you may have a problem.
For your top sellers, POS data may justify higher order quantities to unlock volume discounts or free freight. You can run reports showing past sales for these items over the last quarter and project how many units you’ll sell during the vendor’s lead time plus a buffer.
This POS data-driven reordering prevents you from over-buying to hit a discount that you can’t realistically move. POS data also supports vendor negotiations.
When a supplier pushes a large MOQ on a borderline product, you can share sales history from your POS data to demonstrate actual demand and request a lower MOQ or consignment arrangement. In some scan-based trading models, suppliers keep ownership until the item is sold at your POS, and POS data drives the billing.
By grounding vendor decisions in POS data, you avoid emotional or purely relationship-based ordering. You reorder what your POS data proves you can sell, in quantities that make financial sense.
Leveraging Basket Analysis and Attach Rates from POS Data
Beyond single SKUs, basket analysis uses POS data to see which items customers tend to buy together. That information can significantly improve both merchandising and reordering.
Using your POS data, identify common product pairings. For example, chips with soda, shampoos with conditioners, or printer ink with paper. When you know which items are frequently purchased in the same basket, you can co-locate them on shelves, build bundles, or create cross-promotions.
This same POS data helps you manage reordering. If Item A drives sales of Item B through high attach rates, you don’t want B to stock out while A is in full supply. For key pairs, you should coordinate reorder points so both items stay in stock together. This is particularly important for U.S. retailers selling accessories or add-ons that depend on a primary product.
Some advanced POS and retail analytics platforms are starting to include more automated recommendation and assortment tools, sometimes combined with computer vision and AI.
These tools use POS data to suggest which products to feature together or which new items to test, boosting your ability to reorder strategically across a category, not just per SKU.
By constantly reviewing basket-level POS data, you can refine both how you stock and how you reorder, ensuring that your shelves present full stories, not isolated products.
Forecasting Demand with POS Data and Simple Models
You don’t need a PhD in data science to use POS data for demand forecasting. A few straightforward techniques go a long way for small and mid-sized U.S. businesses.
The simplest approach is moving averages. Take your POS data for a SKU over the last several weeks and use the average sales as your short-term forecast. You can weight recent weeks more heavily if your demand is changing quickly. This works well for stable products with mild seasonality.
For clearly seasonal items, use year-over-year POS data. Compare this April’s sales to last April’s, adjusting for growth in your overall business.
If your store grew 10% year-over-year, you can scale last year’s POS data by that factor when planning reorders for this spring. This approach helps plan inventory for U.S. holidays and seasonal categories without complex modeling.
Some POS and analytics providers now offer built-in forecasting features that apply more advanced models behind the scenes. These tools ingest your POS data, detect trends and seasonality, and output suggested reorder quantities.
While they may not be perfect, they can save time and improve accuracy, especially if your catalog is large or your demand patterns are complex.
Whichever method you use, remember that your forecast is only as good as your underlying POS data. Regularly validate forecasts against actual POS data and adjust your models and reorder rules based on real results.
Integrating POS Data with Inventory and Accounting Systems
To fully use POS data to track sales and improve reordering, it should not live in a silo. Connecting your POS to inventory and accounting systems gives you an end-to-end picture of product, cash, and profit.
Integrated inventory management means every sale at the POS automatically updates on-hand quantities. When a purchase order is received, inventory increases and cost data updates. This real-time syncing lets you run reorder reports at any time, knowing your POS data reflects current stock.
Connecting POS data to accounting or ERP software ensures that sales, cost of goods sold (COGS), and margin flow directly into your financials. You can then analyze POS data in terms of gross profit by category, vendor, or location, and tie reordering decisions to cash flow and budget targets.
For omnichannel U.S. retailers, integration with eCommerce platforms is just as important. Online orders should decrement inventory in the same pool as in-store sales, and POS data should capture fulfillment types, such as ship-from-store or BOPIS. This lets you reorder based on total demand, not channel silos.
The more your POS data flows across systems, the easier it becomes to automate routine reordering tasks and focus human attention on exceptions and strategy.
Using Dashboards and Alerts to Operationalize POS Data
Even the best POS data is useless if it just lives in spreadsheets. To truly improve reordering, you need simple, actionable ways to see what is happening and respond quickly.
Most modern POS and analytics platforms provide dashboards that summarize key sales and inventory metrics in real time. Configure these dashboards to highlight low-stock alerts, top selling SKUs, and items with sudden demand spikes.
Make sure these views are available on tablets or phones so U.S. store managers can act on POS data from the sales floor.
Set up threshold-based alerts for critical items. For example, if POS data shows that a top seller is projected to hit zero stock within three days, the system can email or text your buyer. These alerts turn POS data into an early-warning system so you can place emergency orders or transfer stock between locations.
Finally, schedule routine reporting. Many U.S. retailers succeed with a weekly rhythm: on Monday, run POS data reports for last week’s sales, review low-stock and back-ordered items, and approve purchase orders.
On a monthly basis, dive deeper into category-level POS data, update reorder points, and adjust assortment. Consistency is more important than complexity; if your team regularly reviews POS data, reordering improves almost automatically.
Employee Performance and POS Data’s Impact on Reordering
Your staff directly shape how customers buy and how POS data looks. Tracking employee performance through POS data can reveal training opportunities that improve both sales and inventory outcomes.
POS data can show sales by employee, average transaction value, items per ticket, and discount usage. If one associate regularly sells more accessories with the same base item, their POS data will show higher attach rates.
You can then share their techniques with the rest of the team, which increases overall sales and changes reordering needs for accessory SKUs.
You can also track returns and voids by employee. High rates may indicate process issues, fraud risk, or the need for better product knowledge. Cleaning this up improves the quality of your POS data and makes demand patterns more stable, which in turn makes reordering more accurate.
When employees see that POS data is used to reward good performance and to stock items customers actually want, they’re more likely to follow scanning rules and capture accurate information. This positive feedback loop means better POS data, better reordering, and a smoother experience for your U.S. shoppers.
Data Governance, Security, and Compliance for POS Data in the U.S.
As you collect more POS data, you must protect it. U.S. retailers are responsible for securing customer payment information and complying with industry standards such as PCI DSS (Payment Card Industry Data Security Standard).
Start by choosing a secure, reputable POS provider that supports EMV chip cards, point-to-point encryption, and tokenization. This helps keep card data out of your environment, reducing your compliance burden and risk.
POS data used for sales tracking and reordering should not include raw card numbers, only anonymized or aggregated information.
Implement role-based access control so only authorized staff can see sensitive POS data, change prices, or export full transaction logs. Use strong passwords, two-factor authentication, and regular user reviews to keep access up to date when employees join or leave your business.
Finally, adopt a simple data governance policy. Define who owns POS data, how long you retain it, how it is used for analytics, and how you handle customer privacy. While the U.S. doesn’t have a single national privacy law as strict as some regions, state regulations and card brand rules still apply, and good governance builds customer trust.
Secure, well-managed POS data is the foundation that lets you confidently expand analytics and automated reordering without exposing your business to unnecessary risk.
Common Mistakes Businesses Make with POS Data and Reordering
Many U.S. businesses invest in modern POS systems but still struggle to use POS data to track sales and improve reordering. A few common mistakes explain why.
One major mistake is ignoring data hygiene. If product catalogs are inconsistent, barcodes are missing, or staff often use generic buttons, your POS data will be unreliable. Reordering based on bad POS data leads to overstocking some SKUs and stockouts on others.
Another issue is relying on gut feel instead of POS data. Long-time owners may trust their instincts, but as assortments grow and channels multiply, it’s easy to misjudge what sells. POS data often reveals surprising winners and laggards, and ignoring that information can cost real money.
Some retailers use POS data but only at a high level, such as total daily sales. That’s a start, but it doesn’t drive reordering. You must drill down to SKU, category, and time patterns to get real value.
Finally, many businesses fail to operationalize POS data. They run reports sporadically, with no consistent routine, so reordering stays reactive. Avoiding these pitfalls means taking POS data seriously as a strategic asset, not just a byproduct of checkout.
Getting Started: A Simple 30-Day Plan to Use POS Data Better
If you’re new to using POS data to track sales and improve reordering, start small with a focused 30-day plan.
Week 1: Clean the basics. Standardize your product catalog, confirm barcodes, and ensure each item has a vendor, cost, and category assigned. Train staff to always scan items instead of using generic keys. This step immediately improves future POS data quality.
Week 2: Define key reports. Set up POS data reports for weekly sales by SKU, low-stock items, and top sellers by category. Configure dashboards and basic alerts for your top 50 items. Have managers review these reports every Monday.
Week 3: Add reorder rules. For your top 20 A-items, use POS data to estimate average daily usage and lead time, then set rough reorder points. Start using system-generated purchase suggestions instead of purely manual ordering.
Week 4: Review and refine. Compare what you ordered to what actually sold in the last few weeks. Adjust reorder points, refine which SKUs are A/B/C items, and expand the process to more products.
By the end of 30 days, POS data will be driving real changes in how you track sales and reorder inventory. From there, you can layer on more advanced analytics as your comfort grows.
FAQs
Q.1: How often should I review POS data for reordering?
Answer: For most U.S. retailers and restaurants, a weekly review of POS data is a good baseline. High-volume locations or fast-moving categories may need daily review, at least for top A-items.
The key is consistency: review the same POS data reports at the same time each week and adjust orders accordingly.
Q.2: What if my POS data is incomplete or messy?
Answer: Don’t wait for perfection. Start by cleaning the top 20–50 SKUs that drive most of your sales, according to POS data. Fix names, barcodes, and vendor links for those items.
As you see results, expand to more products. Even partial improvements in POS data can noticeably improve reordering for your biggest sellers.
Q.3: Can a small U.S. business really benefit from POS data analytics?
Answer: Yes. Many cloud POS systems now include built-in analytics, dashboards, and simple forecasting tools aimed at small businesses. You don’t need a full-time analyst to use POS data. Start with basic sales and inventory reports, then gradually adopt more advanced features as you get comfortable.
Q.4: How long should I keep historical POS data?
Answer: From an operational standpoint, at least 12–24 months of POS data is extremely helpful for understanding seasonality and trends.
Some U.S. retailers keep 3–5 years of POS data for deeper analysis and long-term planning, subject to storage limits and privacy considerations. Check with your POS provider about data retention policies and export tools.
Q.5: Do I need AI or advanced analytics to improve reordering with POS data?
Answer: Not at first. Simple rules based on POS data—like reorder points, safety stock, and A/B/C classification—already deliver big wins.
AI-driven tools can help once you have solid processes, large assortments, or complex multi-location operations. Think of AI as an accelerator for good POS data habits, not a replacement for them.
Conclusion
When you use POS data to track sales and improve reordering, you move from guessing to knowing. Instead of reacting to empty shelves or overcrowded stockrooms, you’re proactively planning based on real customer behavior captured at your point of sale.
By cleaning your catalog, tracking the right KPIs, analyzing POS data by product, time, and basket, and integrating with inventory and accounting systems, you create a closed loop. Sales at the POS automatically inform what you buy, when you buy it, and how much you keep on hand.
For U.S. retailers and restaurants, this approach leads to higher availability, fewer stockouts, healthier cash flow, and better customer experiences. Whether you run a single boutique or a growing multi-location chain, you can start now with the POS data you already have.
The key is to treat POS data as a strategic asset. Make it part of your weekly routine, build simple reordering rules from it, and refine those rules over time. Do that consistently, and POS data becomes one of the most powerful tools you have to grow sales and run a smoother, more profitable business.